Liquidus Projection of Al-Mg-Zn
Purpose: Learn to calculate and use a liquidus projection in a ternary system
Module: PanPhaseDiagram
Thermodynamic Database: AlMgZn.tdb
Batch file: Example_#1.7.pbfx
As mentioned in Isotherm of Al-Mg-Zn at 500°C and Isopleth of Al-Mg-Zn at 15 at% Zn, isotherms and isopleths are two types of phase diagrams used to view the phase relationship in a ternary system. Another type of phase diagrams commonly used to understand a ternary system is the liquidus projection which is the projection of the liquid surface onto the base triangle plane. In this example, we will calculate the liquidus projection of Al-Mg-Zn ternary system.
Calculation Procedures:
-
Load AlMgZn.tdb following the procedure in Pandat User's Guide: Load Database , and select all three components;
-
Perform phase projection following the procedure in Pandat User's Guide: Phase Projection ;
-
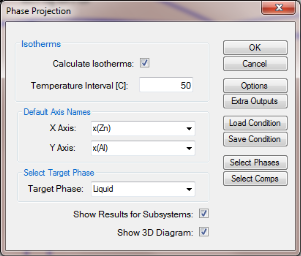
Set Calculation Condition as shown in Figure 1;
Post Calculation Operation:
-
Label phase field following the procedure in Pandat User's Guide: Icons for Graph on Toolbar;
-
Change graph appearance following the procedure in Pandat User's Guide: Property;
-
Label the isothermal lines by put the cursor on each line and then press F2;
Information obtained from this calculation:
-
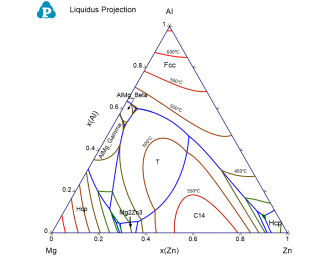
The phase name labeled in each region indicates the primary solidified phase from liquid when the given alloy composition falls in that region;
-
The univariant liquid projection lines (blue lines) trace the composition of the liquid phase for the three-phase equilibrium among the liquid and the other two phases separated by the liquid projection line;
-
The isothermal lines (from red to green with temperature descending) represent the liquidus temperatures. The liquidus temperature for all the compositions along each line is identical;
-
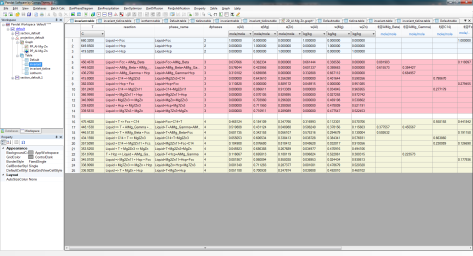
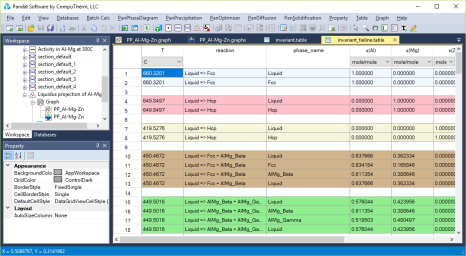
Each triple point at the intersection of three projection lines represents a invariant reaction (four phases in a ternary system) involving the liquid phase. All the invariant reactions are listed in invariant table as shown in Figure 3. The composition of each phase involved in the invariant reaction is listed in invariant_tieline table as shown in in Figure 4.


